Fast-Capture Log Imaging & Digitizing Log Data Services
Wallace International, LLC has the technology and the experience in-house to provide fast and accurate solutions to all your well log data needs. Wallace International, LLC has Neuralog¹ and Powerlog-11² applications to capture, manage, enhance and display all your well log data. Wallace International, LLC’s well log data services combine our experienced staff and state-of-the-art technology to provide our clients with optimum well data integrity and well log analysis.
- Neuralog Software product includes log and map scanning, digitizing & printing, organizing and managing data
- Powerlog-11.02 a GeoSoftware LLC petrophysical package that includes machine learning & deep learning capabilities as well as sophisticated multimineral solvers for complex lithologies in conventional & unconventional formations/reservoirs.
Turn Your Mountain of Paper Wireline Well Logs & Maps Into a Manageable Digital Asset


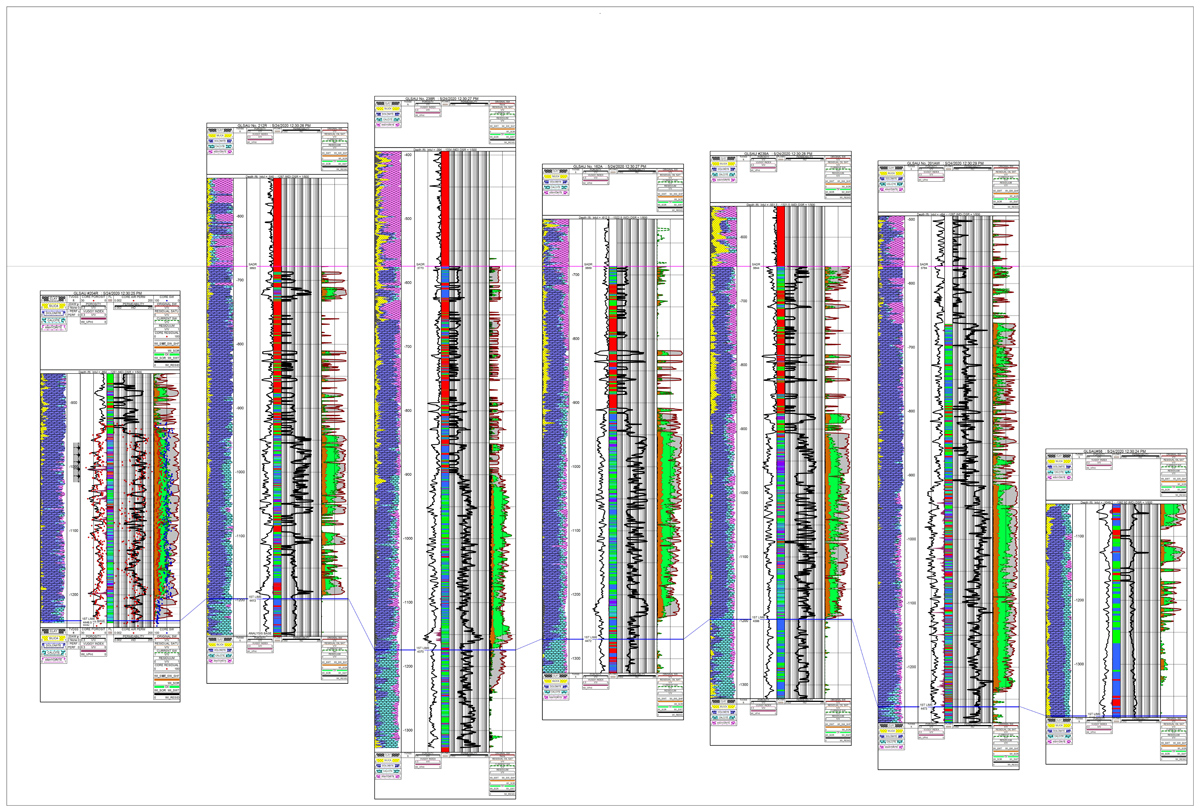
Log Cross Section Plotting Services
Wallace International, LLC has the expertise to provide any multi-well log presentation cross sections that the client desires. Logs can be hung from any location or formation top. Cross plot output files can be presented in PDF, TIF, or JPG formats.
Seismic Reconstruction Services
Wallace International, LLC has entered into a partnership with R2VTECH Inc. who provides seismic vectoring and trace tracking services. Combining with R2VTECH’s considerable experience with unique proprietary software, they can produce a digital output which is true to the original seismic data. Seismic vectoring quality varies widely across the industry. Although some vectored SEG-Y files may initially appear acceptable, they will often be missing much of the underlying data. R2V’s SEG-Y output derives from newly developed vectoring software with several techniques.
- R2VTECH uses image editing software specifically designed for large image and can consolidate multiple seismic images into one section.
- Shot point and CMP data is recorded.
- R2VRECH software predicts the invisible positive overlap of the peaks and also tracks the negative tough wiggle line.
- Each trace is band pass filtered and amplitude balanced across the whole trace.
- The final output is represented as a 32-BIT IBM floating point SEG-Y file.
- Navigation information can be added to the SEG-Y files for the easier loading.
- Most color seismic sections can be accurately digitized to SEG-Y, common examples of this display type include Grey scale, Black-Red and Red- Blue.
- The input to reconstruction process is a scanned image of the seismic section in Tiff, Gif, Jpeg, PNG & Bmp format.
After reconstruction of seismic wave-forms R2VTECH would, if required, populate the seismic data with navigation information before conversion to SEG-Y. The client may supply the X & Y values of header population or R2VTECH may be required to digitize the navigation information from seismic line maps and then load them to seismic data.
Example of different type of seismic sections and SEG-Y output: Red- Black, Red- Blue & Grey wiggle seismic section


Call For More Information About Well Log Data Services
For more info, contact the oil and gas industry experts at Wallace International, LLC at 972-386-4581 or use our contact form.